FEATURE · DATA
Every feature as a row. Every property as a column.
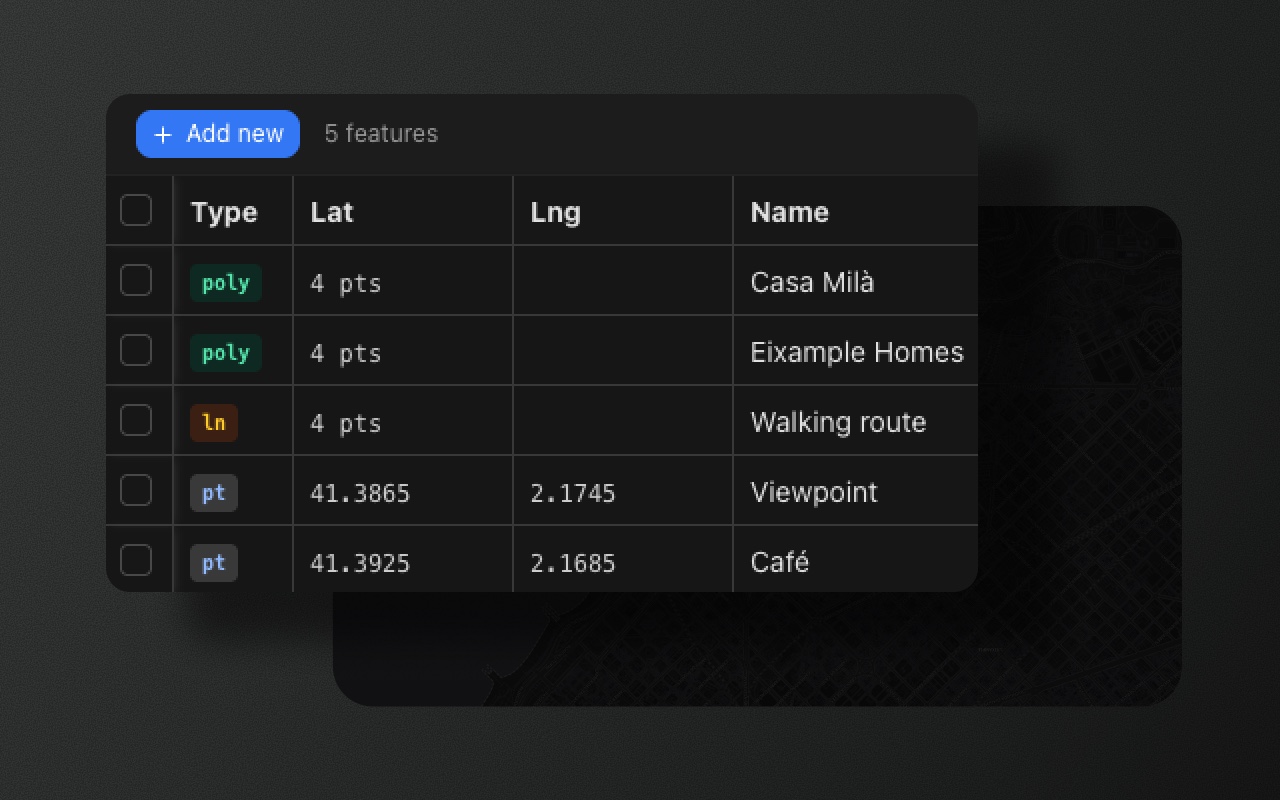
A spreadsheet view of your feature collection. Edit values inline, sort by any column, and stay in sync with the map. Free under MIT in every Element Editor package.
Try it
- 1Press T to open the table
- 2Click Operator to sort by it
- 3Tick a row to find it on the map
When a list of features becomes a dataset
Drawing shapes is one half of the job. Managing the data that goes with them is the other. A ten-feature collection fits in a sidebar. A hundred-feature collection doesn't — you need columns, sorting, bulk edits, keyboard navigation. Spreadsheet ergonomics.
The data table turns your FeatureCollection into a grid. Every feature is a row. Every schema field is a column. Rows and map selection stay synchronized: click a row, the map selects and pans; select on the map, the row highlights and scrolls into view.
What you get
Inline editing. Click a cell, type, commit. No modal, no form popup. Edits commit to the FeatureCollection immediately — onChange fires, just like any other edit.
Selection sync. Click a row → map selects and pans. Shift-click for multi-select. Lasso on the map → rows highlight and scroll into view.
Schema-aware columns. Columns are generated from your schemas: pick one schema to see its features and fields, or all to see every field. No manual column config.
Sort, filter, resize, paste. Spreadsheet basics. Sort any column ascending or descending (arrows show the direction). Show one schema's features or all of them. Drag column edges to resize. Paste text from the clipboard into a selected cell, for example a value copied from a spreadsheet: the first cell is used, and invalid values (such as text in a number column) are ignored.
Virtualized scrolling. Handles thousands of features smoothly. The grid renders only the visible rows.
Shortcut and position
Press T to toggle the table. Arrow keys to navigate cells. Enter to edit. Esc to cancel.
The table docks at the bottom of the map: drag its top edge to resize it, or expand it to full screen. In the split layout it is a permanent panel in the bottom third of the editor, beside the layers list.
What it looks like in code
import { Suspense } from 'react'
import { MapContainer, TileLayer } from 'react-leaflet'
import { ElementEditorUIProvider, GeoStoreProvider, ElementEditorControls } from '@element-editor/adapter-leaflet'
import { DataTablePanel } from '@element-editor/ui'
import '@element-editor/adapter-leaflet/style.css'

export default function MyMap() {
  return (
    <ElementEditorUIProvider>
      <GeoStoreProvider>
        <div data-elm-theme="light" style={{ position: 'relative', width: '100%', height: '600px' }}>
          <MapContainer center={[48.86, 2.35]} zoom={12} style={{ width: '100%', height: '100%' }}>
            <TileLayer url="https://tile.openstreetmap.org/{z}/{x}/{y}.png" />
            <ElementEditorControls onChange={(data) => console.log(data)} />
          </MapContainer>
          {/* Lazy-loaded, so it needs its own Suspense boundary */}
          <Suspense fallback={null}><DataTablePanel /></Suspense>
        </div>
      </GeoStoreProvider>
    </ElementEditorUIProvider>
  )
}This is the Leaflet adapter. DataTablePanel is exported from @element-editor/ui and works
the same with the MapLibre adapter. In @element-editor/react, the panel is already
assembled — press T to open it.
Things to know before you ship
- Free under MIT. The data table ships in every package. No license check, no feature gate.
- Column set follows the schema filter. With all schemas shown, the table has every schema's fields as columns (cells stay empty where a feature's schema lacks the field). Pick one schema to see only its features and fields.
- Sort and filter are in-memory. The table is not intended for 100,000+ feature datasets. For very large collections, paginate or server-side filter before loading.
Works with
- Schemas — every schema field becomes a column. Typed validation runs on inline edits.
- GeoJSON editor — see and edit the raw JSON that the table is editing.
- Import and export — import a GeoJSON file and the table is pre-populated.
Built on react-data-grid
The underlying grid is react-data-grid — the same one used by dozens of serious React apps. Virtualized rows come with the grid. Column generation, selection sync, schema integration, and the editing commit flow are Element's contribution.